
Infrared Images Study
At the Center for Biofeedback and Behavior Therapy, we maintain our biofeedback therapy standards to mainstream science. We continually develop new strategies and innovative techniques that are effective and simple to use.
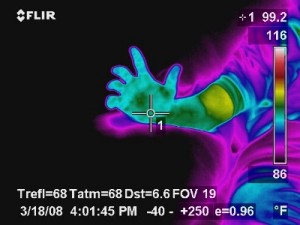
1. A seasoned biofeedback patient demonstrated how he can increase his peripheral body temperature on cue. Increasing peripheral body temperature has cathartic effects on the body. The cross hair indicates a high temperature 99.2 degrees.
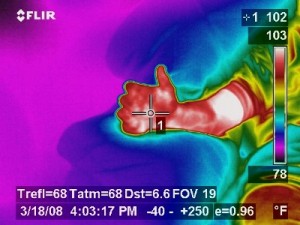
2. Upon cueing this patient to use his biofeedback techniques…2 minutes later, his temperature increases to 102 degrees. This was a commanded response by the patient..
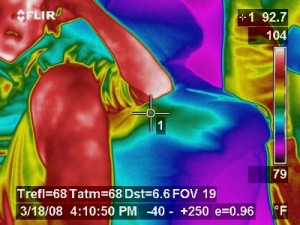
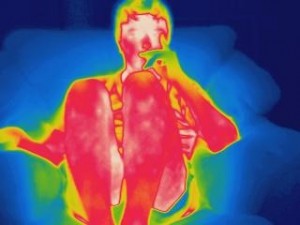
3. You can see here that not only are his extremities growing hot, but his face and upper torso are also heating up. The spectrum read out on the side shows a color measure.
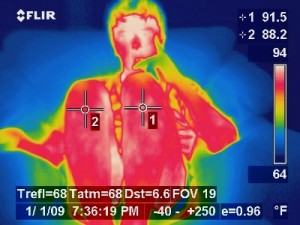
4. This patient has osgood schlatters disease in his left knee. There are two cross hair set on each knee. Cross hair #1 shows a higher temperature 91.5 degrees then cross hair #2, 88.2 degrees. This temperature difference is purposeful. Notice how the effected areas of the osgood in knee #1 are hotter (white spots) then in knee #2. Introducing heat into an effected area is healing.
5. This image is the same as image #4 without all the measure. See how the effected area in knee #1 is noticeably different (i.e. more white spots).
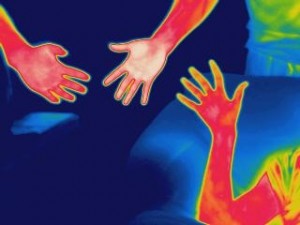
6. Three different hands. The one in the middle is Rusty’s. Notice how his glows bright white, indicating more heat. This image depicts how his physiology operates differently due training and experience.